Visual aids like bars, charts, and graphs make your presentation more appealing. Previously we showed you how to add PDFs and spreadsheets, videos, mp3 audio files, and tables. However nothing looks more impressive than a colorful chart, an upward trending graph, or comparison bars. In this article we will show you how to easily create bars and charts in WordPress without writing a single line of code.
The Problem with Bars and Charts in WordPress
There are many WordPress plugins to add bars, charts, and graphs to your site. However, the most common complain we have heard from our users is that these plugins are usually too complicated to use. Some of these plugins even expect users to add data inside a shortcode in extremely complicated formats.
Instead of using those plugins, most users end up creating charts in their office applications and converting them into images. This could work if you are not planning to ever change this chart, and you are satisfied that it does not really acts like a chart. Considering that no data or visual aid appears as the user takes their mouse over the image.
Ideally, you would need something that allows you to add data from a data source on your computer or on the web. Populates charts, pies, graphs and bars with your data. Creates beautiful, interactive, and colorful charts that dynamically re-size themselves to adjust for mobile and tablets. Most importantly you need a solution that allows you to update data whenever you want.
How to Properly Add Bars and Charts in WordPress
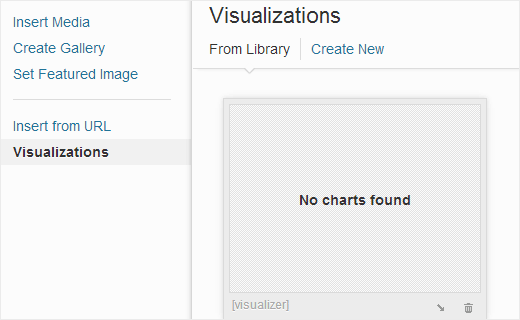
First thing you need to do is install and activate the free Visualizer plugin. After activating the plugin, you can simply create a new post or edit an existing one. On the post edit screen click on Add Media button. You will notice a new menu item in your media uploader for Visualizations. Clicking on it will display your Visualizations library. However, since you have just installed the plugin it will be empty. Click on Create New to create a new chart.
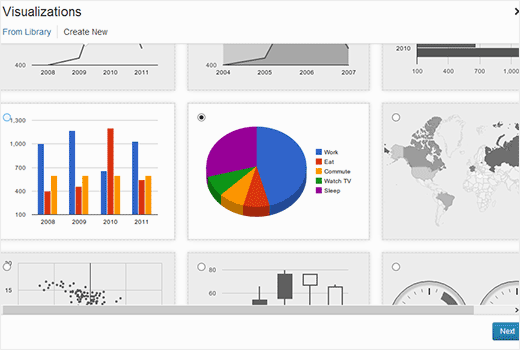
On the next screen, this plugin will ask you to choose which type of chart, bars, or graph you want to create. Select a chart type and then click Next.
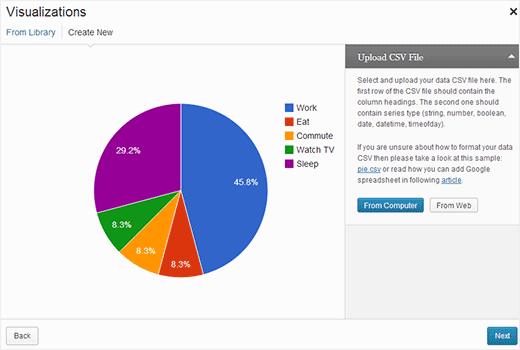
Next screen will ask you to click on Upload CSV File menu on the right, which will show you two options. First option is to upload a CSV file from your computer and the second option is to populate the chart from the web using Google Drive spreadsheet. We will show you both of these options.
Adding a Chart in WordPress From a Google Drive Spreadsheet
Unlike some other WordPress plugins that use shortcodes to enter data for the charts, Visualizer allows you to populate your chart with data from Google spreadsheets or by manually uploading a CSV file. To create a chart from a Google Drive spreadsheet go to Google Drive and create a new spreadsheet or edit an existing one. Make sure that the first row of the spreadsheet has column names and the second row has data types. Supported data types are string, number, bolean, date, datetime, and timeofday.
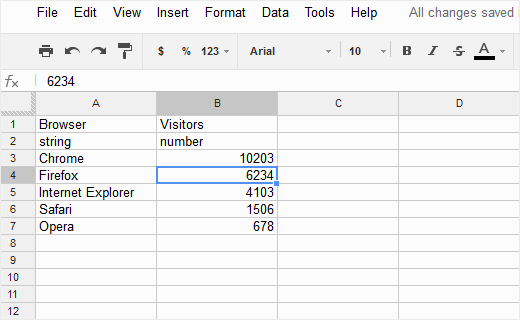
Once you have your spreadsheet ready click on File » Publish to the web…. This will open a pop up window. Click on the publish button to make this spreadsheet available to the web. Under Get a link to the published data section choose CSV comma separated values. Copy the link generated below, you will need this link later.
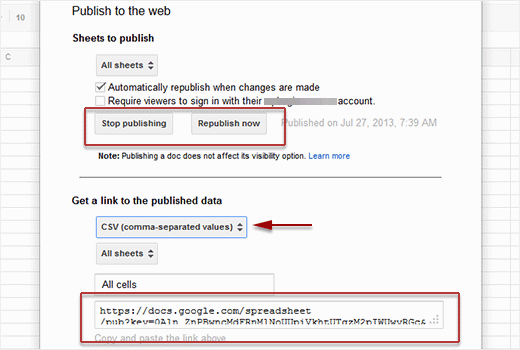
Now back to your WordPress site in the plugin settings, click on From Web button and paste the URL you just copied from Google drive spreadsheet. Visualizer will now load the data from your Google docs spreadsheet and show you a sample chart. Click next to modify the chart looks, colors and other settings.
On the next screen, you will see a menu on your right hand. You can change visual settings of your chart. You can add a title, adjust legend positions, change colors, transform your chart in 3D, etc. Once you are satisfied with the look of your chart click on Insert Chart button to add it to your post.
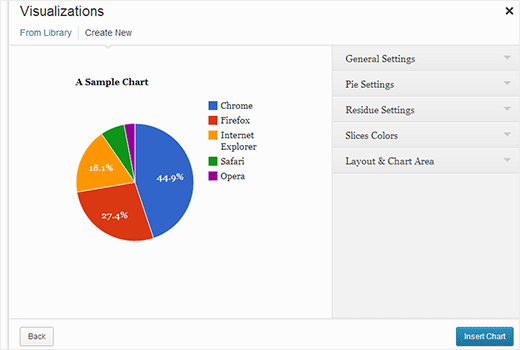
Clicking on Insert chart button will add a chart shortcode in your post. You can see how it looks by previewing your post or publishing it.
Adding a Chart in WordPress using a CSV file
Adding a chart and populate it with data from a CSV file is similar to the process mentioned above. You will just have to upload CSV file from your computer instead of adding a URL. However, when preparing a CSV file to use with Visualizer make sure that columns are separated by commas, first row contains column names, second row contains data types. Also make sure that there are double quotes at the beginning and the end of your CSV file. See a sample CSV file below:
"Browser,visitors
string,numbers
Chrome,7894
Firefox,6754
InternetExplorer,4230
Safari,2106
Opera,627"
Editing or Updating your Charts in WordPress
All charts you create with Visualizer are stored at Media » Visualizer Library. From there you can clone a chart, delete it, or edit its visual settings.
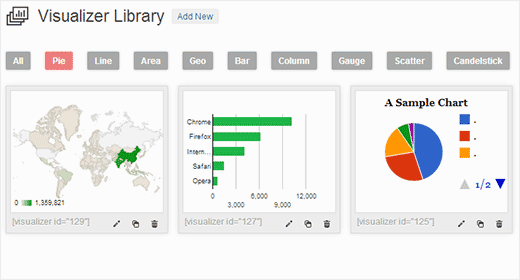
Updating data for an existing chart without changing the chart is quite easy with Visualizer. If you added data from a Google spreadsheet then all you need to do is update data in your spreadsheet and go to File » Publish to the web… and republish your spreadsheet. Your changes will automatically reflect in your chart.
On the other hand, if you uploaded a CSV file, then you need to update the CSV file on your computer. Once done, select the chart that you want to update and click on the edit link below the chart. In the Upload CSV file section simply upload your new CSV file. Changes in the data will automatically reflect in posts or pages where you have inserted that chart.
Adding a Chart in a WordPress Sidebar Widget
Visualizer uses shortcodes to insert charts. To create a chart go to Media » Visualizer Library and click on the Add New button. Once you have created your chart, you will come back to Visualizer Library page where you will see a shortcode below the chart you just created.
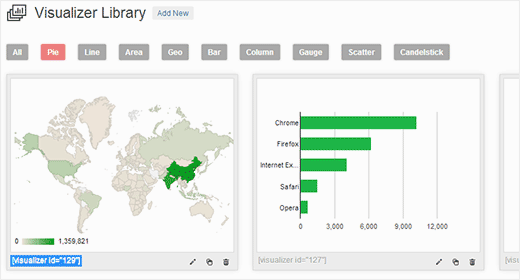
Copy the shortcode and go to Appearance » Widgets. Drag and drop a text widget to your sidebar and paste the shortcode inside the widget. Give an appropriate title to your widget and save it. Since you can use Google Spreadsheets with Visualizer you can add dynamic charts that reflect frequently updated data. For example, you can show a company’s stock value or a progress bar.
We hope that this article helped you add bars and charts in your WordPress site. We hope that you will enjoy generating dynamic beautiful visualizations of data instead of adding static images. For feedback and questions, you can leave a comment below. Let us know how you add charts to your website.
To leave a comment please visit How to Create Bars and Charts in WordPress with Visualizer on WPBeginner.
via WPBeginner http://feeds.wpbeginner.com/~r/wpbeginner/~3/54Ccw9JgMpg/
WordPress Hosting Tips
No comments:
Post a Comment